Kalbe Annual Report Dashboard
Kalbe
2023
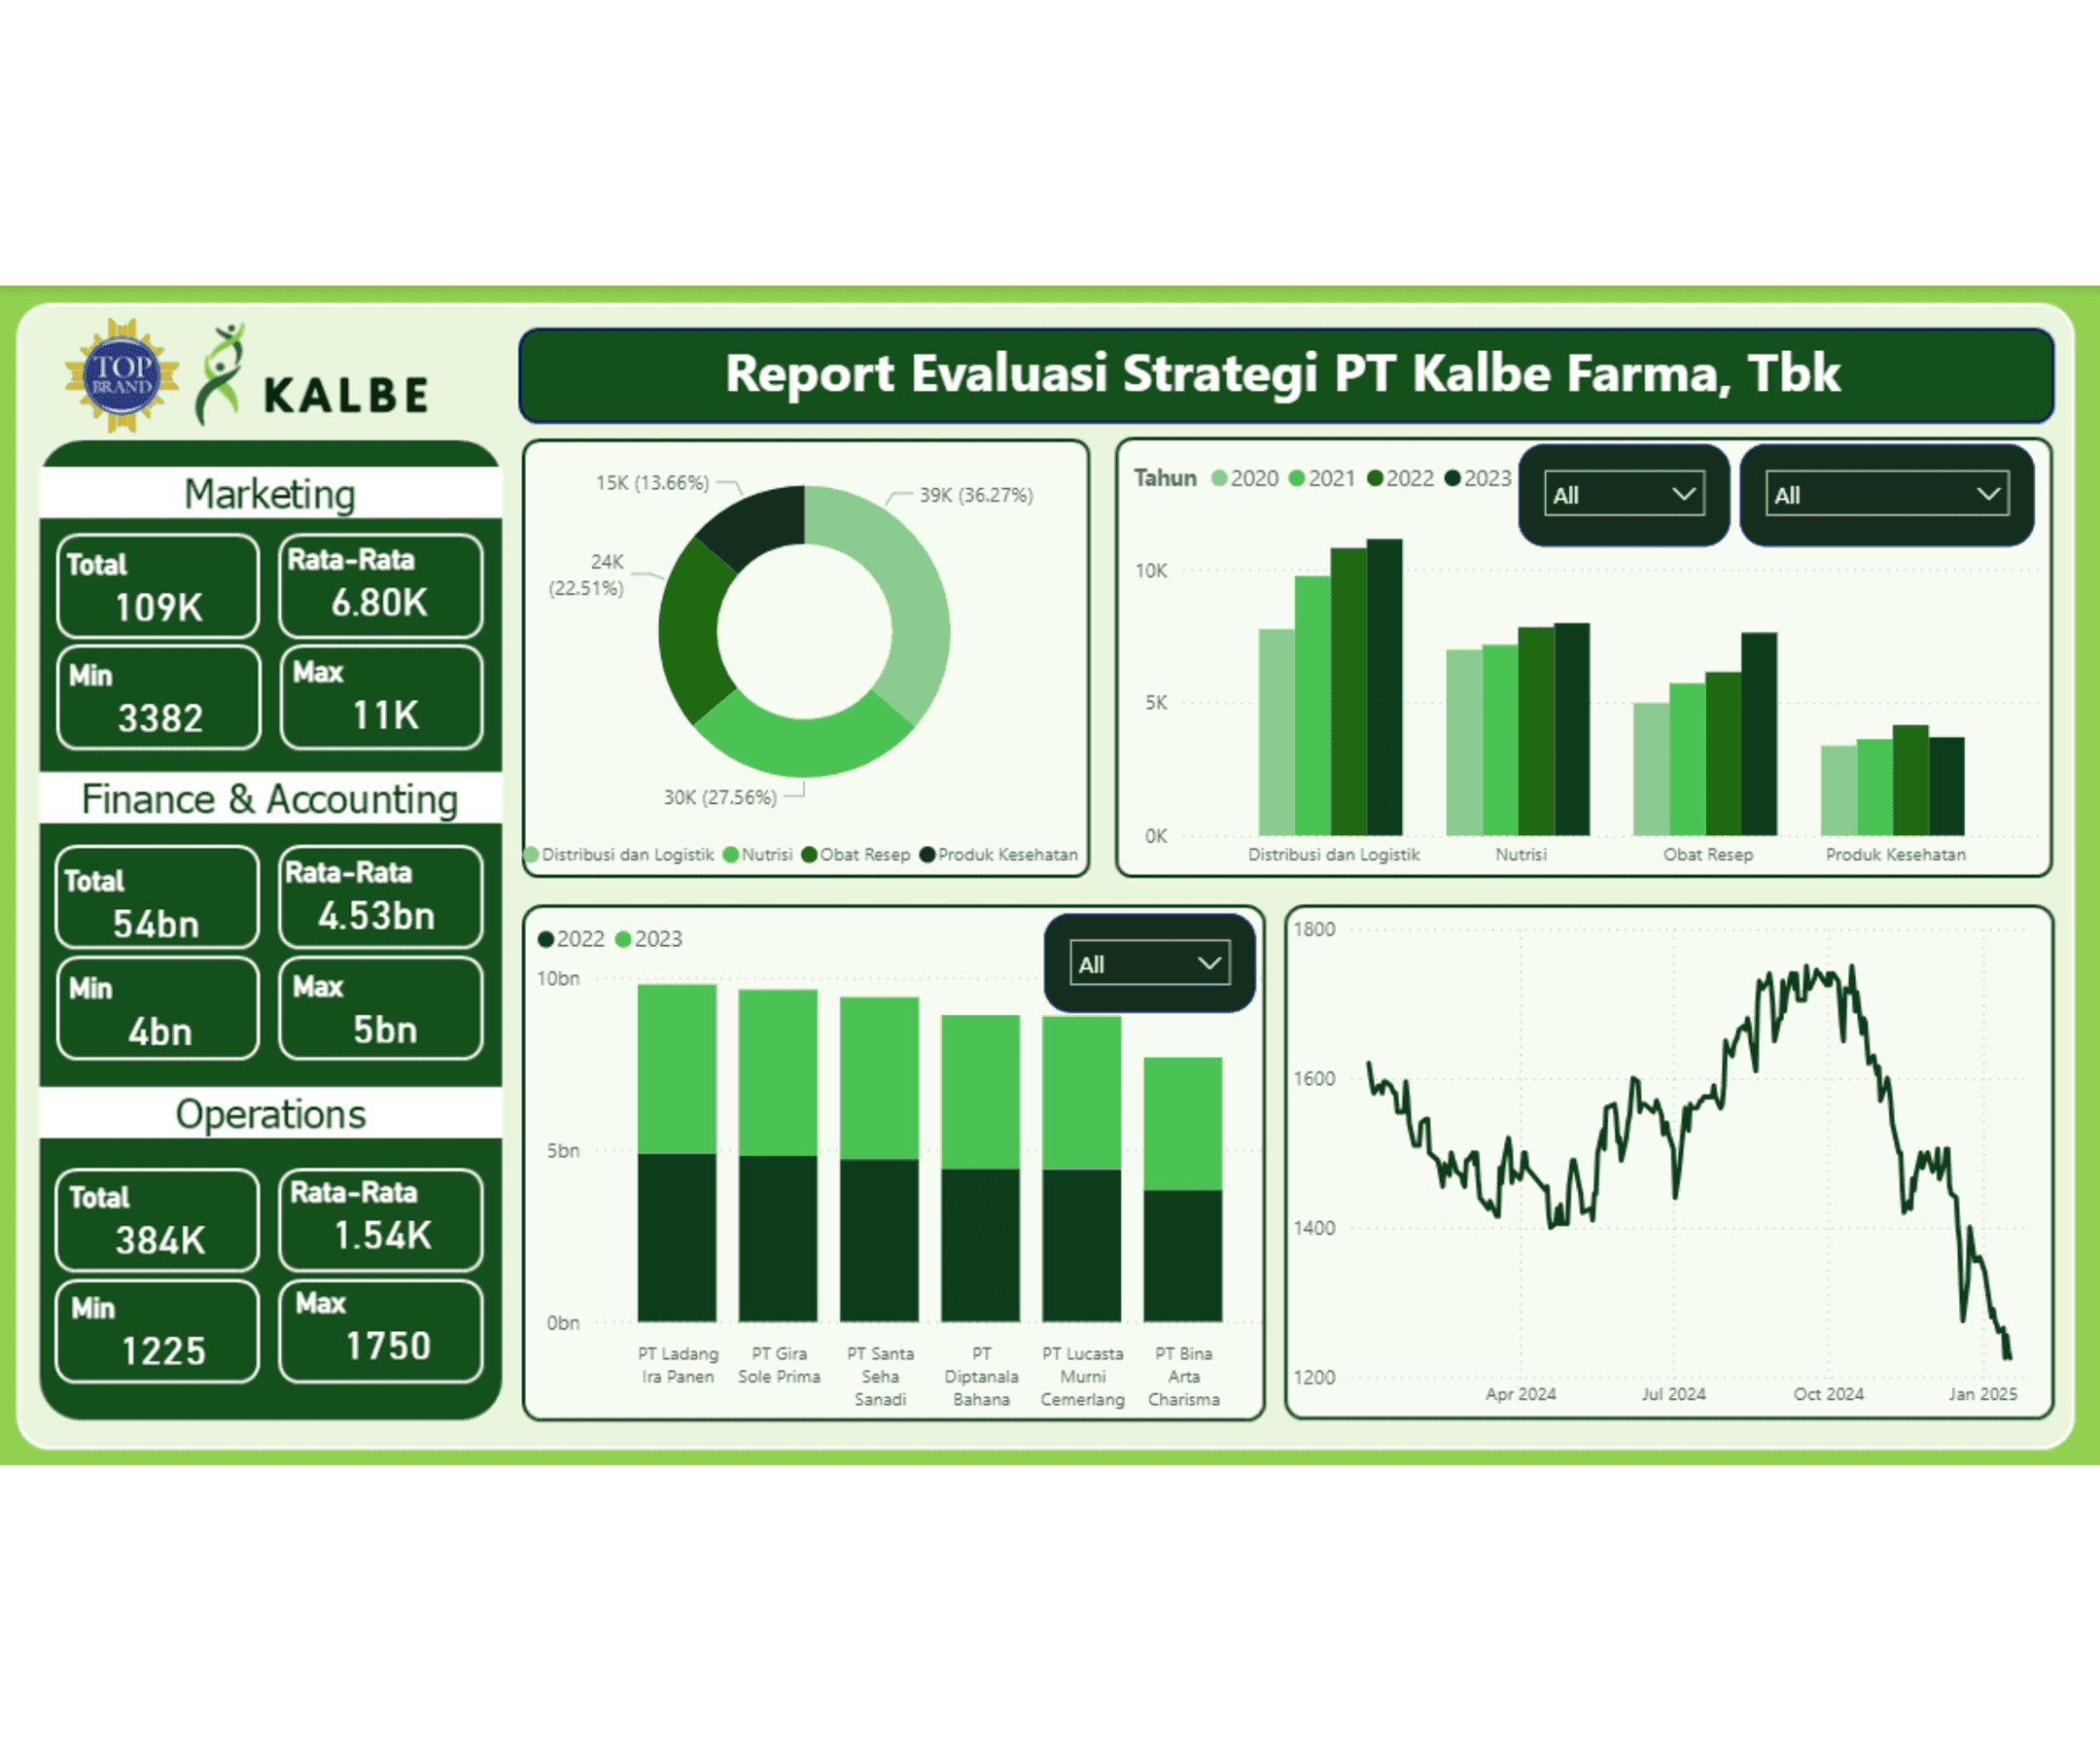
Background
This dashboard was designed to convert PT Kalbe’s annual report into an interactive visualization that provides clearer visibility into year-over-year financial performance, operational achievements, and strategic progress, offering a more accessible way for stakeholders to interpret complex corporate data.
Responsibilities
I independently developed the dashboard by extracting key information from the annual report, validating the data, organizing it into performance categories, and building dynamic Power BI visualizations that enable users to navigate and analyze company metrics with ease.
Key Features
The dashboard integrated financial indicators, operational highlights, and strategic KPIs into interactive charts, segment comparisons, and trend analyses, allowing users to explore corporate performance across multiple dimensions through a clean and intuitive interface.
Result
The final tool successfully transformed static report content into actionable visual insights, helping management monitor performance trends, identify gaps, and make more data-driven decisions, while demonstrating my ability to translate complex business reporting into meaningful analytics for stakeholders.